
📊 Full opportunity report: Q3 2026 SaaS Earnings Pre-Brief: The Litmus Test for the Agentic-Disruption Thesis on ThorstenMeyerAI.com — validation score, market gap, and execution plan.
TL;DR
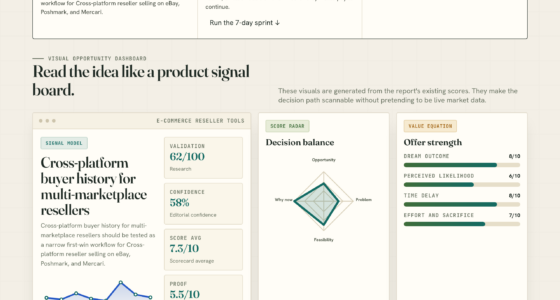
The Q3 2026 SaaS earnings cycle is set to test the validity of the agentic-disruption thesis, with companies like ServiceNow and Salesforce signaling a shift toward consumption-based, AI-driven revenue models. Market expectations and guidance will determine if the transition accelerates or stalls, impacting SaaS valuations.
The Q3 2026 SaaS earnings cycle will provide the first comprehensive data to confirm whether the agentic-disruption thesis is accelerating or stalling, as major SaaS companies prepare to report in July and August. This development is crucial for investors, founders, and enterprise customers, as it indicates the future trajectory of SaaS economics and valuation models.
Recent earnings from ServiceNow and Salesforce in April and May have already signaled a significant shift in SaaS revenue structures. ServiceNow reported a 22% YoY growth in subscription revenue and raised its AI ACV guidance from $1 billion to $1.5 billion, with over half of its revenue now coming from consumption-based models. Despite beating consensus metrics, its stock dropped 18%, reflecting market skepticism about the durability of this transition.
Salesforce reported a 10% YoY increase in total revenue and introduced new metrics like Agentic Work Units (AWUs), which measure AI-driven task completion. Its restated fiscal 2026 segments explicitly distinguish between traditional subscription revenue and agentic, AI-driven revenue streams. Agentforce ARR reached $800 million, up 169% YoY, with a Q/Q growth of 57%. These figures suggest a strategic pivot toward consumption and AI-enabled models, but market reactions indicate uncertainty about the pace of this transition.
The upcoming earnings reports will either confirm or challenge these signals. Key metrics to watch include non-seat share of net new business, agentic work unit growth, and guidance on margins and profitability. The market is particularly attentive to whether companies will provide clear guidance on the sustainability of consumption-based revenue and whether new joint ventures or structural responses are announced.
Six companies. Four metrics.
The litmus test for the agentic-disruption thesis at scale. July-August 2026.
Q1 baseline: ServiceNow beat earnings, raised AI ACV 50%, lost 18% in a day. Salesforce restated segments to separate Agentforce Apps from Data 360. Both stocks repriced lower despite beats. The Q3 cycle either confirms the consumption pivot is durable or accelerates the cohort selloff.
Four metrics. Four watch thresholds.
Investor focus has consolidated around four metrics that determine Q3 reactions. Each beats or misses produces asymmetric stock reactions: small misses produce large drops, small beats produce muted reactions.

SaaS & Software Subscription Tracker: Professional Business Expense Logbook for B2B, Agencies, and Entrepreneurs. Manage Software Renewals, App Licenses, and IT Costs.
As an affiliate, we earn on qualifying purchases.
As an affiliate, we earn on qualifying purchases.
Six companies. July-August 2026.
Six major SaaS companies report Q3 2026 calendar reports across July-August 2026. Each needs to prove specific elements of the four-metric scorecard.
July
name
August
name
August
exposed
July
exposed
July
exposure
August
exposure

Marketing Analytics: Pricing Strategies and Price Analytics: Unlocking Profits with Data-Driven Pricing Strategies, Behavioral Insights, and Real-World Analytics for Smarter Marketing Decisions
As an affiliate, we earn on qualifying purchases.
As an affiliate, we earn on qualifying purchases.
Three outcomes. One cohort.
25/50/25 probability allocation reflects genuine uncertainty in the data. Q1 was already mixed (beats produced selloffs); Q3 follows the same pattern unless metrics move decisively.
- Non-seat 50%+ sustainsNOW pivot durable.
- AWU >50% Q/QCRM Agentforce traction holds.
- $1M+ ACV >120% Y/YEnterprise concentration accretive.
- RDR >108%Switching costs real.
- Outcome: NOW recovers 18% drop. Multiple expands.
- Non-seat 50%NOW pivot equilibrium.
- AWU 35-45% Q/QCRM deceleration visible.
- $1M+ ACV 80-100%Saturation early signals.
- RDR 105-110%Durability uncertain.
- Outcome: Multiples compressed through Q4 next litmus test.
- Non-seat <45%NOW pivot stalled.
- AWU <30% Q/QCRM Agentforce deceleration confirmed.
- $1M+ ACV <80%Enterprise saturation visible.
- RDR <105%Consumption customers churning faster than seats.
- Outcome: 10-20% cohort compression. Recovery extends mid-2027.
SaaS as a category is in active structural transformation. Each quarterly cycle through 2026-2027 produces incremental data on whether the per-seat-to-consumption transition is durable or destructive. Q3 2026 is one data point in a longer arc.
consumption-based SaaS billing platform
As an affiliate, we earn on qualifying purchases.
As an affiliate, we earn on qualifying purchases.
Four assignments. By role.
Update positioning ahead of Q3.
Long ServiceNow / Salesforce on non-seat-share + AWU-growth thesis if you believe consumption pivot is durable. Underweight if structurally worse than per-seat. Use four-metric scorecard to update each quarterly cycle through 2027. Asymmetric setup means small misses produce large reactions.
Time the Q3 cycle precisely.
If incumbents miss → accelerate customer-acquisition + fundraising. If incumbents beat → prioritize retention + unit economics over top-line. 25/50/25 probability suggests cautious-optimistic positioning is default. The customer-acquisition window opens or closes based on Q3 prints.
Negotiate multi-year protections.
AWU rate caps, renewal-term commitments, exit provisions. Incumbents that commit are pricing for durable equilibrium; incumbents that resist are extracting transitional premium. Q3 reveals which is which. Time multi-year commitments to incumbent transparency on consumption pricing.
Engage on structured-financing.
Anthropic-Blackstone JV template applies to SaaS facing same scaling challenge. Engagements through July-September; SaaS companies missing on four metrics become more receptive. Window for advantaged structuring is open through Q4 2026; thereafter pricing advantage compresses as template replicates.

Music Studio 12 – Music software to edit, convert and mix audio files for Win 11, 10
Music software to edit, convert and mix audio files
As an affiliate, we earn on qualifying purchases.
As an affiliate, we earn on qualifying purchases.
Implications of Q3 SaaS Earnings for Agentic-Disruption
This earnings cycle is a critical test for the agentic-disruption thesis, which posits that SaaS revenue models are shifting from per-seat licensing to consumption and AI-driven metrics. The outcome will influence SaaS valuations, investor expectations, and strategic decisions by companies and enterprise customers. A confirmed acceleration could lead to a reevaluation of SaaS economics, while a stall might reinforce traditional models.
Recent SaaS Earnings and Strategic Shifts
The April-May 2026 earnings cycle provided early signals of a structural transition. ServiceNow beat all top-line and profitability metrics, raising its full-year guidance and AI ACV targets, yet its stock declined sharply. Salesforce’s restated segments and introduction of AWUs further emphasize a strategic move toward AI and consumption models. These developments reflect a broader industry trend, with investors increasingly re-pricing SaaS companies based on their exposure to consumption and AI-driven revenue streams.
Prior to these reports, the industry had seen a gradual shift away from traditional per-seat licensing, with frontier labs and Chinese low-cost APIs increasingly serving AI deployment needs. The upcoming earnings will reveal whether this transition is gaining momentum or facing headwinds.
“Over half of our revenue now comes from consumption-based models, reflecting our strategic pivot toward AI and infrastructure consumption.”
— ServiceNow CEO Bill McDermott
Uncertainties Surrounding SaaS Transition Pace
It remains unclear whether the acceleration in consumption-based SaaS revenue will be sustained through Q3 and beyond. Market reactions suggest skepticism about the durability of these models, and guidance from companies may or may not clarify the long-term trajectory. Additionally, the impact of potential joint ventures or structural responses remains uncertain, with some companies rumored to be exploring such options but no official announcements yet.
Next Milestones and Market Indicators
Following the July and August earnings releases, analysts and investors will closely evaluate the reported metrics, guidance, and any new structural initiatives. Key indicators include changes in non-seat revenue share, agentic work unit growth, margins, and the emergence of JV-style partnerships. These signals will determine whether the industry collectively moves toward embracing the agentic-disruption thesis or reverts to traditional SaaS models.
Key Questions
Why is the Q3 2026 earnings cycle so important for SaaS companies?
The Q3 2026 earnings will reveal whether the industry’s shift toward consumption-based, AI-driven revenue models is accelerating, stalling, or reversing, which will influence valuations and strategic directions.
What are Agentic Work Units (AWUs) and why do they matter?
AWUs measure tasks accomplished by AI agents, serving as a new metric for SaaS companies to demonstrate AI-driven productivity and growth, signaling a strategic shift toward agentic models.
How might the industry react if the transition stalls?
If the shift toward consumption-based SaaS models stalls, valuations could re-rate higher, and companies might revert to traditional licensing models, impacting long-term growth expectations.
Are there any structural responses or joint ventures expected?
While some rumors suggest SaaS firms may partner with private equity or other entities to fund AI infrastructure, no official JV announcements have been made, and such moves remain speculative.
Source: ThorstenMeyerAI.com